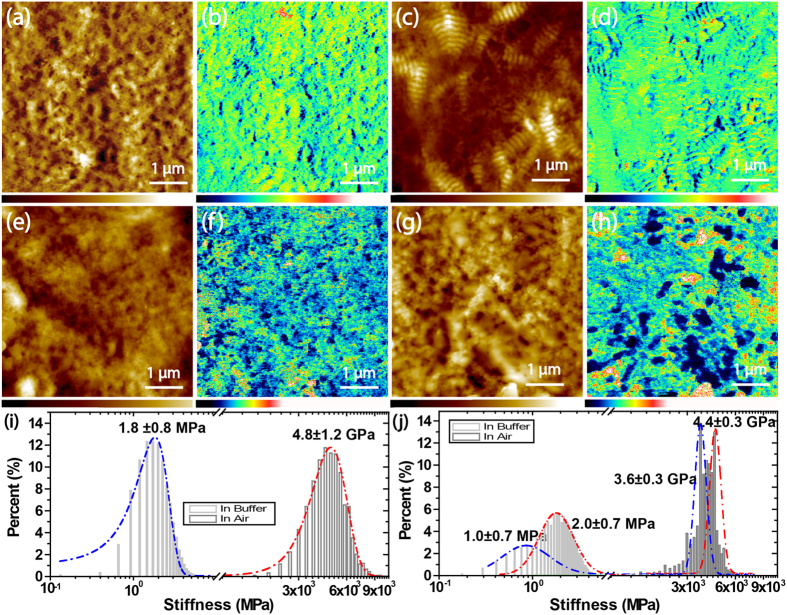
Figure 4. The comparison between the control and FECD-DMs.
(a,c,e,g) The morphology images; (b,d,f,h) The stiffness maps; (a,b) The control sample in air; (c,d) The FECD-DM in air; (e,f) The control sample in physiological buffer; (g,h) The FECD sample in physiological buffer; The Z ranges in (a,c) are from 0 nm to 121.3 nm while that of in (e,g) are from 0 nm to 235.9 nm; The Z ranges in (b,d) are from 0 GPa to 17.8 GPa while that of in (f,h) are from 0 MPa to 4.8 MPa; The corresponding stiffness distribution of (i) the control and (j) FECD-DM in air and in physiological buffer, respectively.

