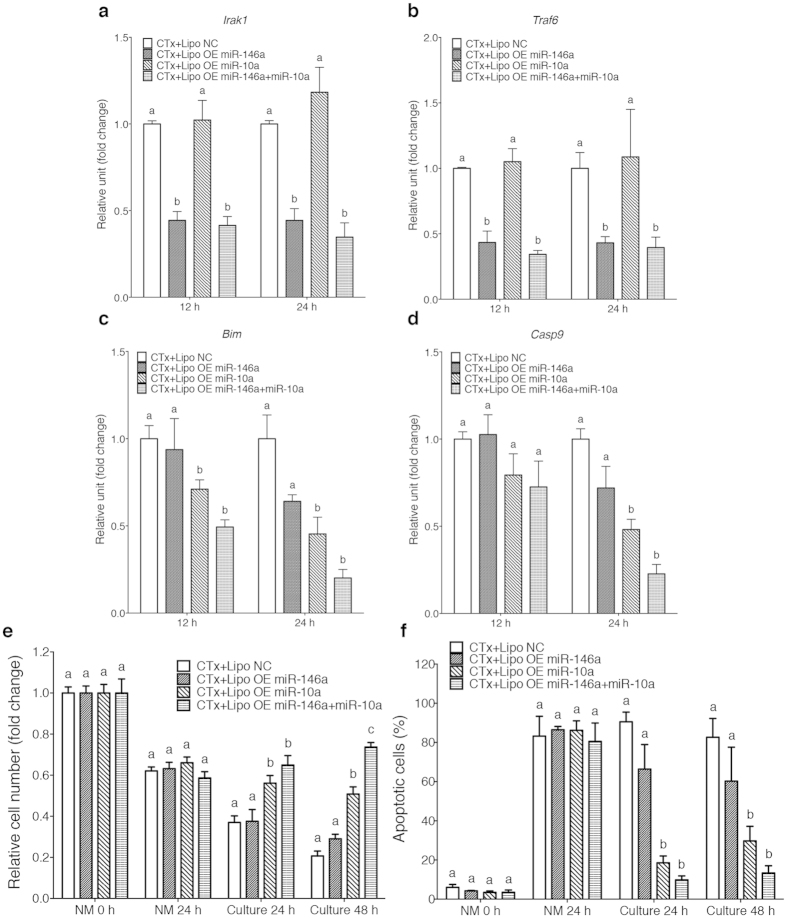
Figure 3. MiR-10a recapitulates the effects of AFSC-derived exosomes on damaged GCs in vitro.
(a–d) The expression levels of Irak1 (a), Traf6 (b), Bim (c) and Casp9 (d) of damaged GCs cultured with liposomes with various cargos at different time points. Error bars represent s.e.m. n = 3. Different characters (a–c) represent significant differences (P < 0.05) among each group; Tukey’s multiple comparisons test. (e) The relative cell number (fold change) of damaged GCs cultured with liposomes with various cargos at different time points. Error bars represent s.e.m. n = 6. Different characters (a–c) represent significant differences (P < 0.05) among each group; Tukey’s multiple comparisons test. (f) The percentage of apoptotic cells of damaged GCs cultured with liposomes with various cargos at different time points. Error bars represent s.e.m. n = 3. Different characters (a–c) represent significant differences (P < 0.05) among each group; Tukey’s multiple comparisons test.

