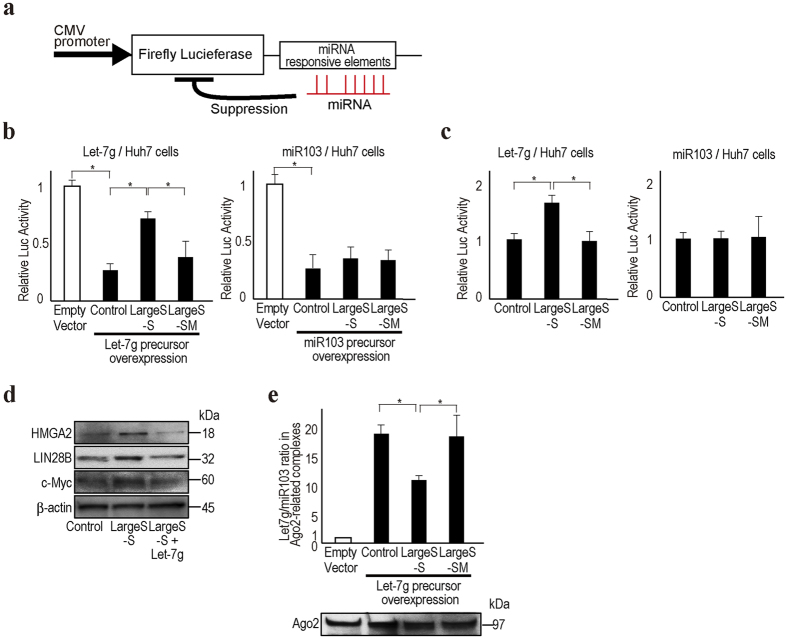
Figure 2. HBV preS2 mRNA inhibits let-7 g function.
(a) The CMV promoter-driven firefly reporter construct is shown. The reporter contains miRNA-responsive elements in its 3′UTR. Luciferase expression is suppressed by the miRNAs. (b) Huh7 cells were transiently transfected with the indicated miRNA reporter constructs (pGL4-let-7 g or pGL4-miR103) with or without corresponding miRNA precursor-overexpressing plasmids (pCDH-let-7 g or pCDH-miR103). Luciferase activity was significantly suppressed when overexpressing miRNA precursors (“Control” compared to “Empty vector” which means without miRNA overexpressing plasmid). Expression of Large S–S (pCDH-Large S–S) reversed such suppression by inhibiting let-7 g function (left), but not in case of miR103 (right). The Large S-SM construct (pCDH-Large S-SM) did not show such effects. Data represent the means ± s.d. of three independent experiments, and the values from the cells without miRNA overexpression were set as 1. *p < 0.05. (c) Similar to the description in b, Large S–S inhibited endogenous let-7 g function (left), but not miR103 function (right). In this case, to examine the effects of LargeS-S or Large S-SM construct on the function of endogenous miRNAs, miRNA overexpressing plasmids were not used. Data represent the means ± s.d. of three independent experiments, and the values from the control were set as 1. *p < 0.05. (d) The expression levels of let-7 g target proteins were upregulated in Large S–S stably expressing Huh7 cells according to Western blotting. Forced stable expression of let-7 g in Large S–S-expressing Huh7 cells canceled the effects of Large S–S expression. Representative results from three independent experiments are shown. (e) Let-7 g loading into the Ago2-associated RISC was decreased by Large S–S expression but not by Large S-SM expression. miRNA levels were quantitated in the RISC after immunoprecipitation of Ago2. Equal precipitation of Ago2 was confirmed by Western blotting (bottom). Data are shown after normalizing the let-7 g levels to miR103 levels in the Ago2-associated complexes. The values of the sample without let-7 g overexpression were set as 1. Data represent the means ± s.d. of three independent experiments. *p < 0.05.

