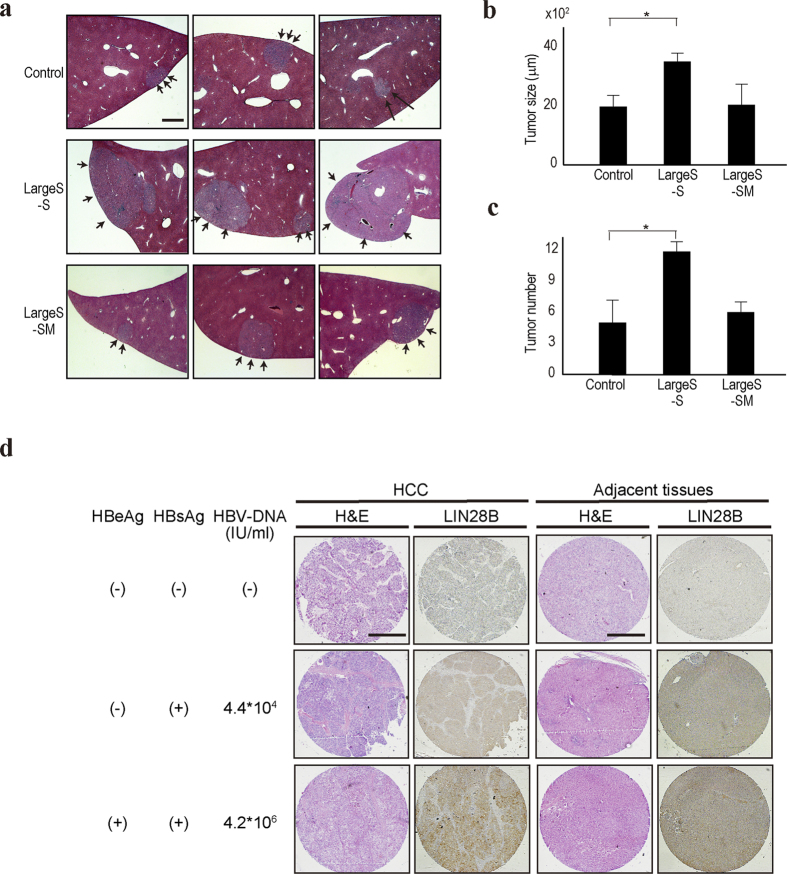
Figure 3. Large S–S transgenic mice were prone to DEN-induced hepatocarcinogenesis.
(a) Representative H&E-stained liver tissues from control, Large S–S transgenic, and Large S-SM transgenic mice are shown. The mice were sacrificed 16 weeks after DEN treatment. Arrows indicate the tumors in the liver. Bar, 500 μm. (b,c) The number and size of the liver tumors from each mouse group are shown. Six mice were used in each group. Data represent the means ± s.d. of three independent experiments. *p < 0.05. (d) LIN28B protein expression levels in the HCC tissues and their surrounding tissues derived from HBV-infected or non-infected patients were determined by immunohistochemistry. Representative images including H&E staining, along with the patient clinical information (the positivity of HBeAg and HBsAg, and the HBV-DNA load in the sera), are shown. The stained proteins are in brown. Bar, 500 μm.

