Figure 5.
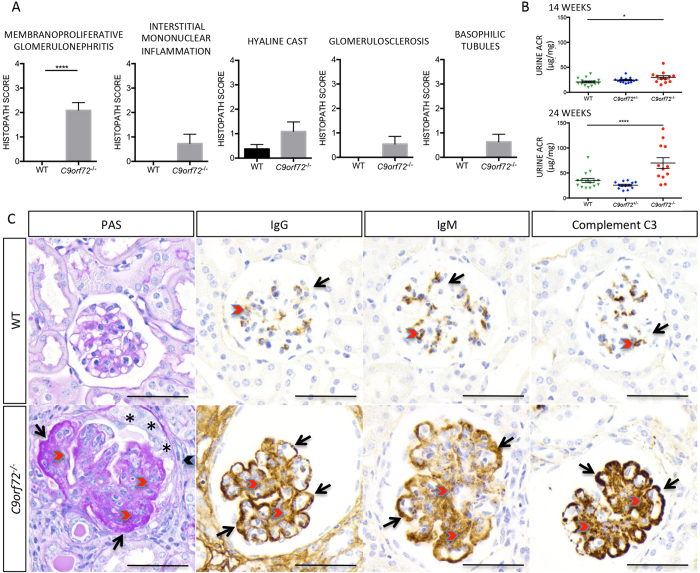
C9orf72−/− mice show evidence of progressive glomerulonephropathy (A) Weighted graphs of histopathological scoring demonstrate the most significant renal changes observed in C9orf72−/− mice are associated with membranoproliferative glomerulonephritis. (B) Urine ACR measurements assayed at 14 and 24 week timepoints from the same cohort of mice indicate onset of albuminuria in C9orf72−/− animals with age. Heterozygous mice display values comparable to WT consistent with the absence of an observed phenotype. (C) PAS Staining and IHC immunoreactivity of mouse glomeruli for IgG, IgM, and C3 demonstrate immune-mediated kidney damage. Mesangial matrix (red chevron) is PAS+ and markedly expanded in C9orf72−/− mouse compared with the delicate matrix seen in the WT. Basement membrane of the vasculature is markedly expanded by PAS+ matrix (black arrows), obliterating the capillary loop. The parietal epithelium is proliferative (*), and Bowman’s capsule is surrounded by connective tissue and mononuclear cells (black chevron). IHC for IgG, IgM, and C3 in WT (top panel) shows delicate capillary loops (black arrows) supported by scant mesangial matrix; faint chromogenic staining of the capillary endothelia is representative of physiologic IgG, IgM, and C3. IHC stippling is also observed in the mesangium (red chevrons). In contrast, glomeruli from C9orf72−/− mice have increased mesangial matrix (red chevrons) and granular deposits of IgG, IgM, and C3. Capillary loop basement membranes are thickened and delineated by subendothelial/subepithelial granular to confluent deposits (black arrows). Chromogenic staining for IgG is also apparent in surrounding renal tissue. Note the increased size of the C9orf72−/− glomerulus compared with that of the WT, and the increase in the urinary space of the glomerulus. (A,C) Data represented is from 35–63 week old females, n ≥ 8 per genotype analyzed. Scale bar represents 50 μm, original magnification, ×600. (A) Graphs represent mean ± s.e.m. (***P ≤ 0.0001 by non-parametric Mann-Whitney) (B) Graphs represent mean ± s.e.m. (*P ≤ 0.05, ***P ≤ 0.0001 by one way ANOVA).

