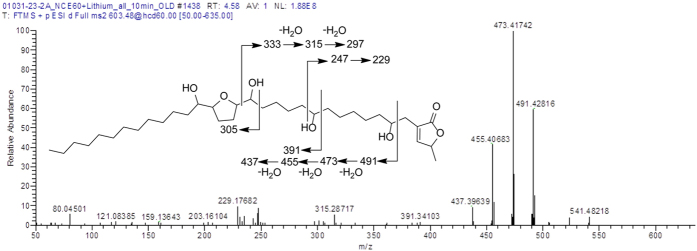
Figure 8. Example characterization of acetogenins.
The MS/MS spectrum of the peak at 4.58 min (coded blue in Fig. 7). These data illustrate the common fragmentation patterns observed with acetogenins. In particular, note the fragments adjacent to hydroxy moieties, thereby facilitating the elucidation of the positioning of the THF ring and each hydroxy group. Based on these data and the associated literature, this compound is tentatively identified as annonacin.

