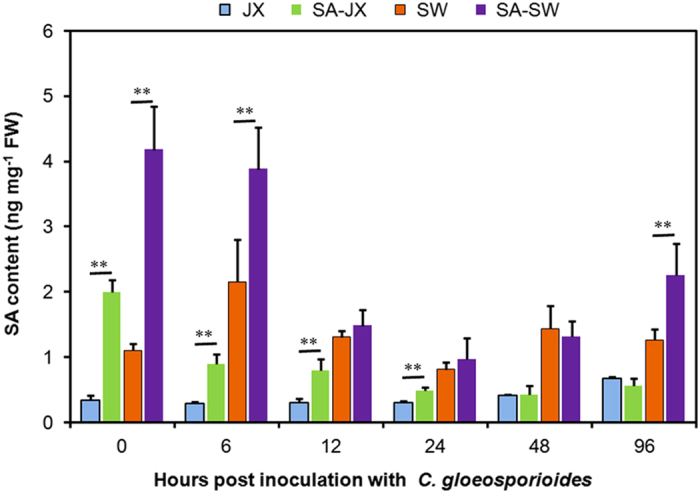
Figure 4.

SA content in Fragaria×ananassa during C. gloeosporioides infection. Free SA was determined in the sixth leaves after mock treatment (0 hpi) or C. gloeosporioides inoculation in cv. JX (susceptible) or cv. SW (less susceptible) with (green bars, SA pretreated cv. JX; purple bars, SA pretreated cv. SW) or without 20 μM SA pretreatment (blue bars, cv. JX; orange bars, cv. SW). Bars represent the mean values of three independent biological samples±s.d. A paired Student’s t-test was performed to analyze the effect of SA pretreatment at every time point; **P<0.01. A paired t-test of the significance in the differences between cultivars was found at every time point and is not shown in the figure.
