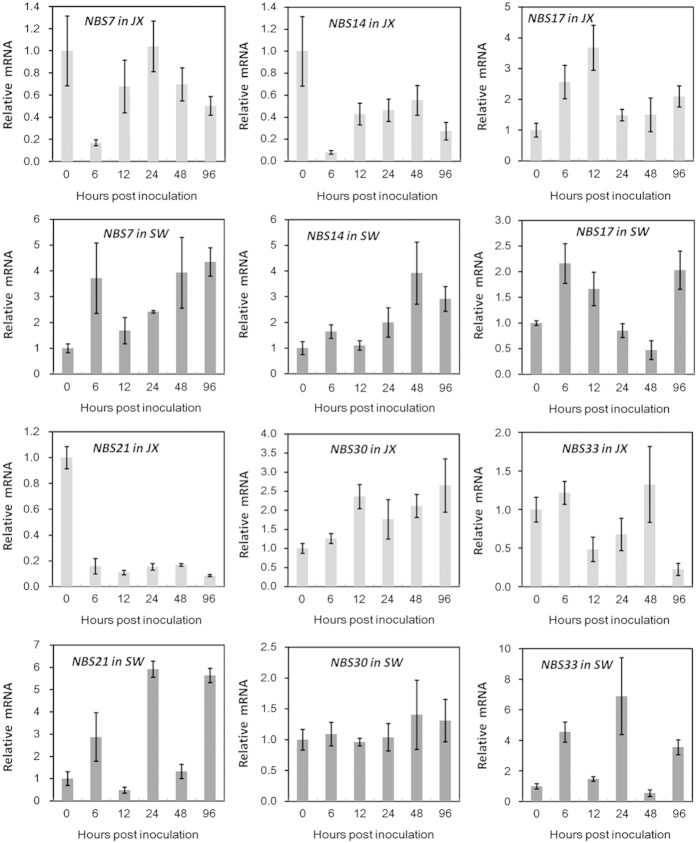
Figure 5.
qRT-PCR analysis of NB-LRR gene transcript levels in strawberry cvs. JX and SW during C. gloeosporioides infection. The expression level of each gene in every cultivar is expressed as the fold change relative to that in mock (0 hpi) treatment. FaRIB413 was used for normalization. Bars represent the mean of two independent biological experiments±s.e.

