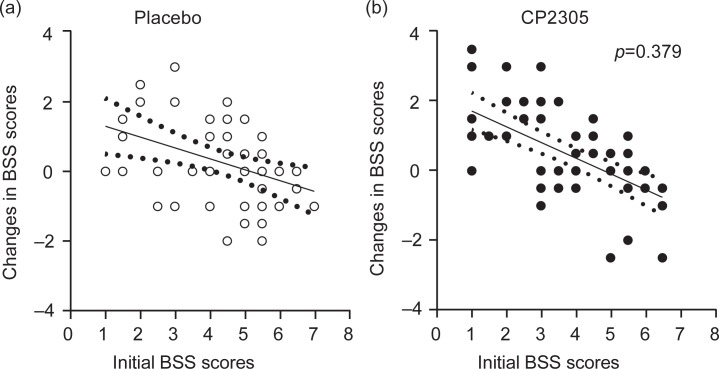
Fig. 2.
Changes in the objective BSS scores of the placebo and CP2305 groups. The solid line is the regression lines, and the dotted lines indicate the bounds of the 95% confidence intervals. ANCOVA was used to compare the adjustments in BSS scores in both beverages. A score of 4 shows the hardness of normal banana-shaped stool. Higher scores indicate softer stools and lower scores indicate harder stools.

