
Figure 2. Principal response curves indicating the effect of the insecticides clothianidin, fipronil and chlorantraniliprole on aquatic assemblages of the experimental paddy mesocosms.
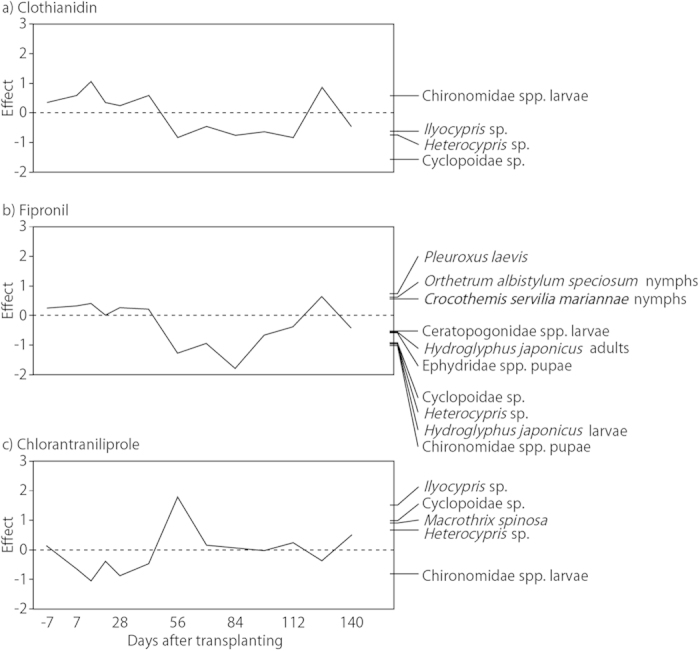
The vertical axes (effect) show the species weight and canonical coefficient. Zero lines indicate the control treatment, and the solid lines indicate the difference in assemblage structure in response to each insecticide application. Only species with a score above 0.5 or below −0.5 are shown.