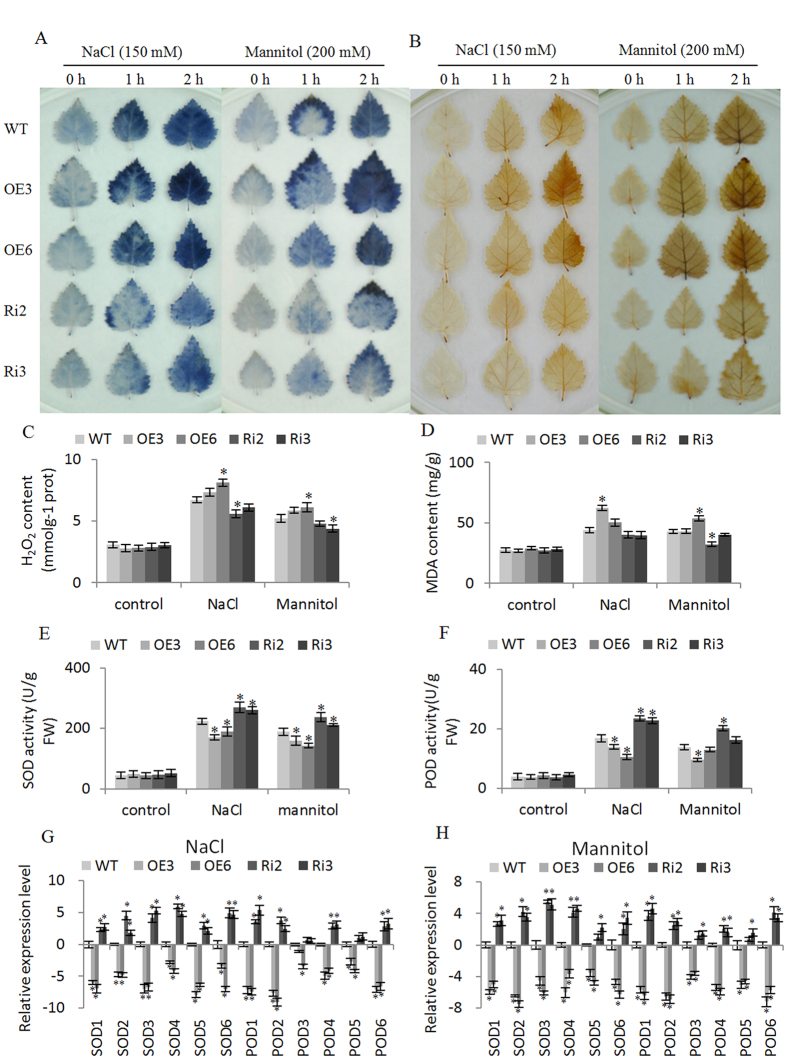
Figure 5. ROS scavenging analyses.
(A,B) diaminobenzidine (DAB) (A) and nitroblue tetrazolium (NBT) (B) staining to reveal H2O2 and O2− accumulation, respectively. The birches grown on WPM medium were treated with 150 mM NaCl or 200 mM Mannitol for 1 or 2 h, and then leaves were detached for DAB and NBT staining; leaves grown on WPM were the control; (C,D) H2O2 content (C) and MDA content (D) analysis; (E,F) SOD (E) and POD (F) activity analysis; (G) the expression analysis of SOD and POD genes in OE, WT and Ri lines under NaCl stress; (H) the expression analysis of SOD and POD genes in OE, WT and Ri lines under mannitol stress. Three biological replications were conducted. The error bars represent the standard deviation (S. D.). Asterisk indicates significant difference between OE lines and WT or between Ri lines and WT (P < 0.05).

