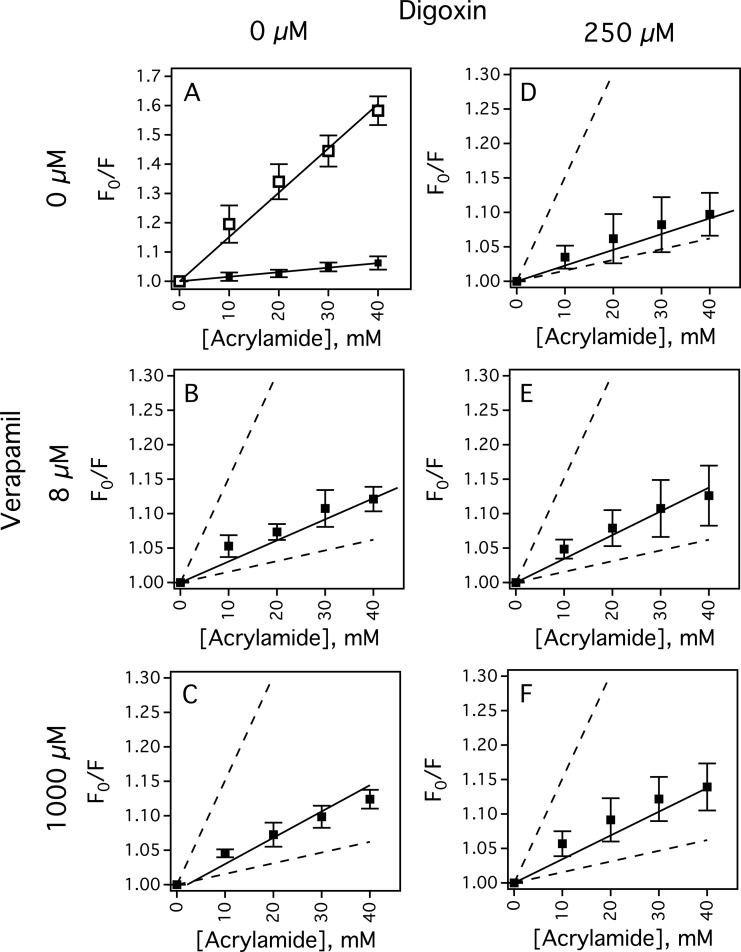
Figure 4. Acrylamide quenching of the Pgp transporter in the presence of verapamil and digoxin.
(A) The Stern–Volmer plots of NATA (open squares) and Pgp in the absence of drugs (closed squares). The Stern–Volmer plots of Pgp in the presence of (B and E) 8 μM and (C and F) 1000 μM verapamil. (D–F) The Stern–Volmer plots of Pgp with 250 μM digoxin added in addition to verapamil. For comparison, the slopes in panel (A) are presented as dashed lines in panels (B) through (F). The average and S.D. are represented as points and bars, respectively, and reflect at least three independent experiments.

