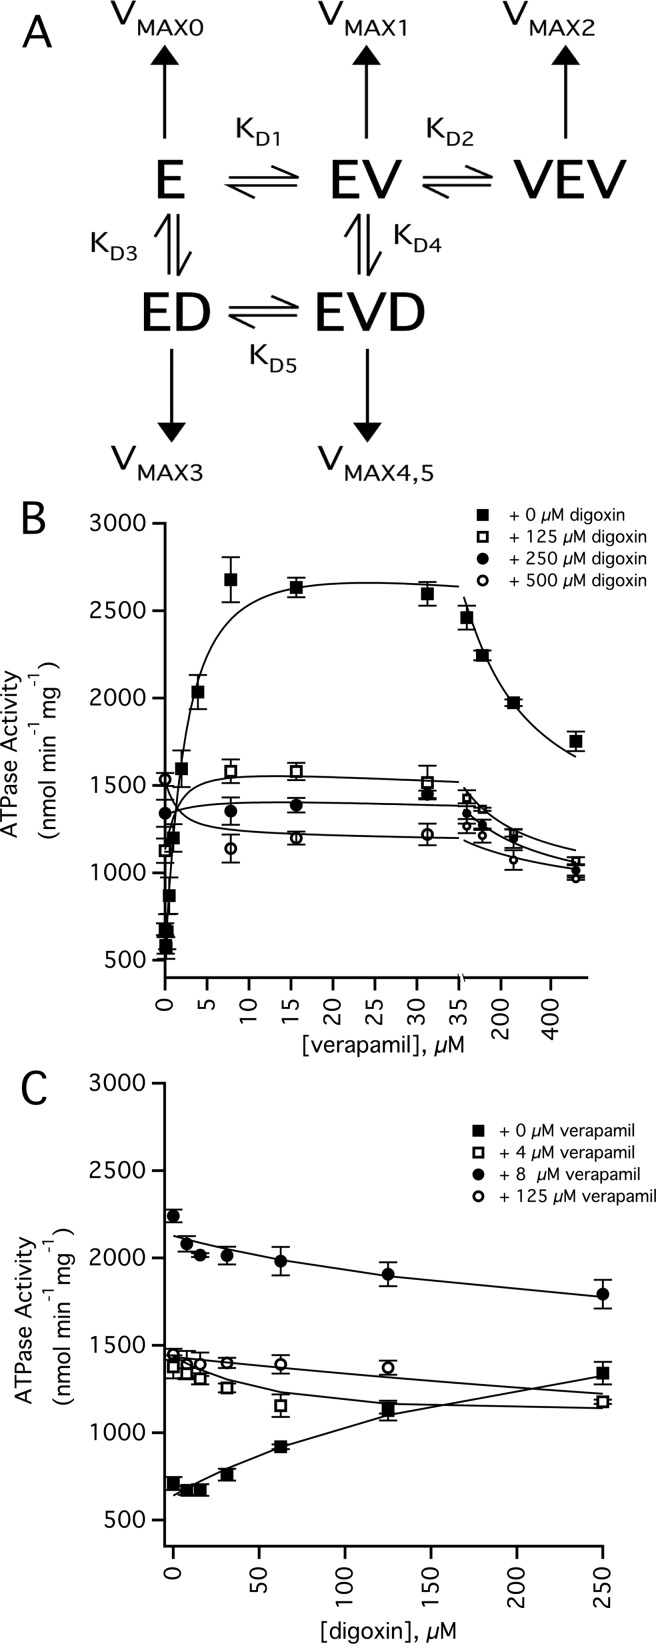
Figure 6. DDI effects of verapamil and digoxin on the ATPase activity of Pgp.
(A) DDI model used to fit the ATPase activity curves. Horizontal and vertical arrows denote the equilibria between bound states and the ATPase activity from the bound states respectively. E, V and D correspond to Pgp, verapamil and digoxin respectively. (B) Verapamil-induced activation of ATPase activity in the presence of 0 μM (closed squares), 125 μM (open squares), 250 μM (closed circles) and 500 μM digoxin (open circles). (C) Digoxin-induced activation of ATPase activity in the presence of 0 μM (closed squares), 4 μM (open squares), 8 μM (closed circles) and 125 μM verapamil (open circles). The fits are shown as lines, the error bars represent the S.D. and the points represent an average of at least three independent experiments. The statistics and the values used to fit the curves are shown in Supplementary Table S1 of the Supplementary Information.

