
Figure 5. OTUs of interest to explain the PCA.
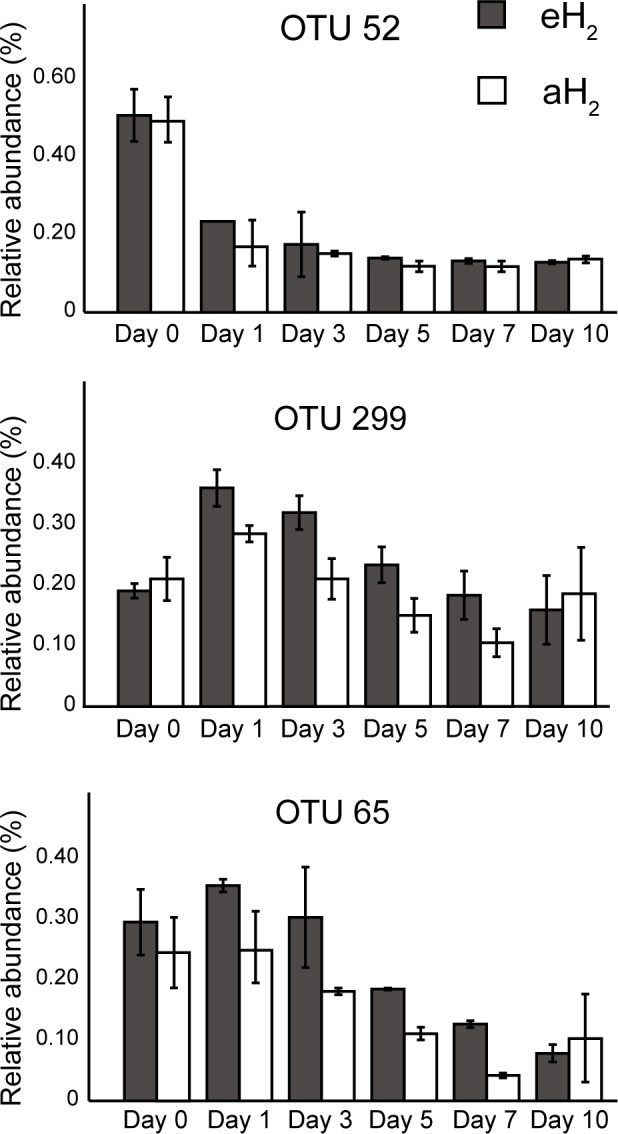
Time series of the relative abundance of the 3 OTUs having a higher contribution than average to explain the two dimensions of the PCA space in soil microcosms. The average and standard deviation measured in replicated microcosms are represented. The closest taxonomic affiliations of OTUs 52, 299 and 65 are, respectively, the bacterial order MND1 (Betaproteobacteria), genus Bacillus (Firmicutes) and the species Bacillus cereus (Firmicutes).