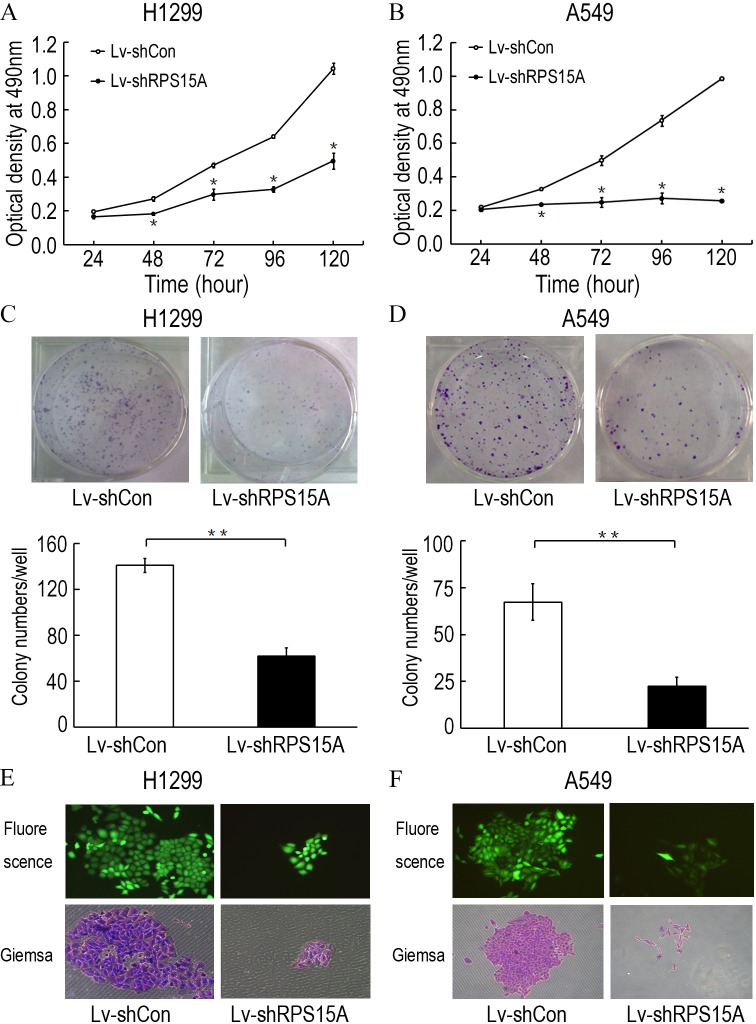
Figure 3. The proliferation of H1299 and A549 cells.
The proliferation of H1299 and A549 cells was inhibited after Lv-shRPS15A infection determined by MTT assay. (A, B) The colony formation abilities of H1299 and A549 cells were determined by colony formation assay after Lv-shRPS15A infection. (C, D) Images of colonies and statistical analysis of the number of colonies. (E, F) Images of colonies recorded under microscope. *P < 0.05, **P < 0.01 versus Lv-shCon.

