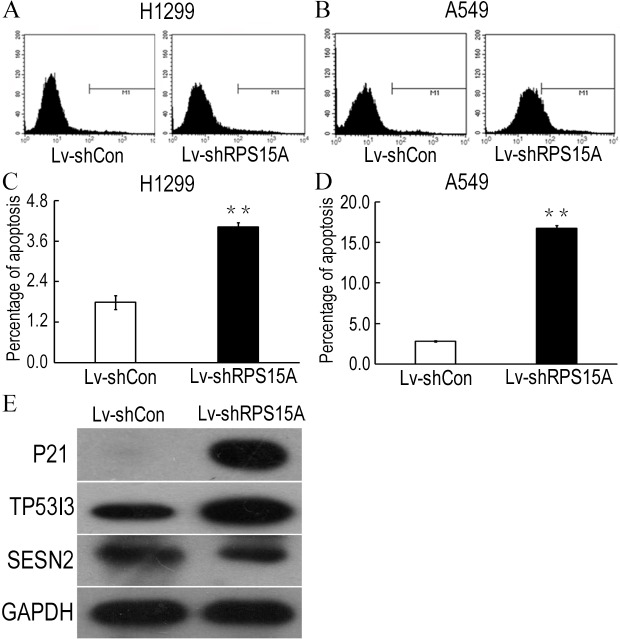
Figure 4. RPS15A knockdown induced apoptotic cells.
RPS15A knockdown induced apoptotic cells were determined by flow cytometry analysis after Annexin V-APC staining. (A, B) Histograms of FACS analysis. (C, D) Percentage of apoptotic cells. **P < 0.01 versus Lv-shCon. (E) Key factors of P53 signaling pathway, such as P21, TP53I3 and SESN2, were examined in Lv-shRPS15A infected A549 cells by using western blotting method. The protein level of GAPDH was employed as a control.

