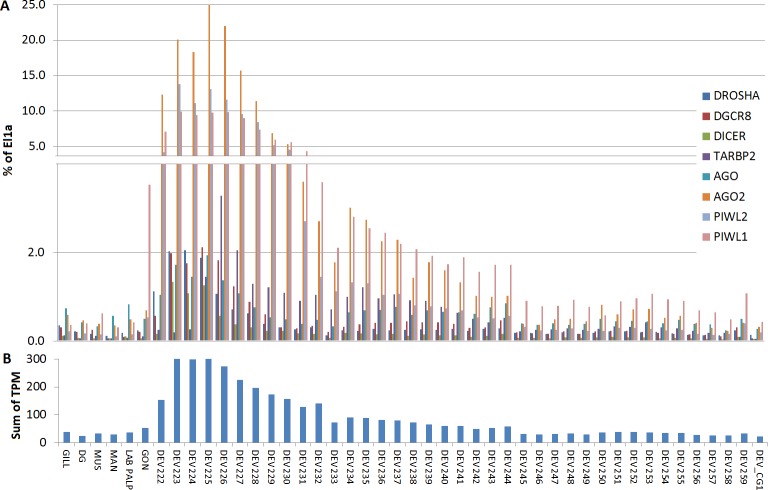
Figure 5. Digital expression analysis in oyster.
The expression of the 8 miRNA biogenesis genes were computed in tissue-specific RNA libraries and in RNA libraries from different developmental phases. (A) Expression values represented as percentage of El1α. (B) Cumulative TPM expression values of the 8 genes in the same samples.

