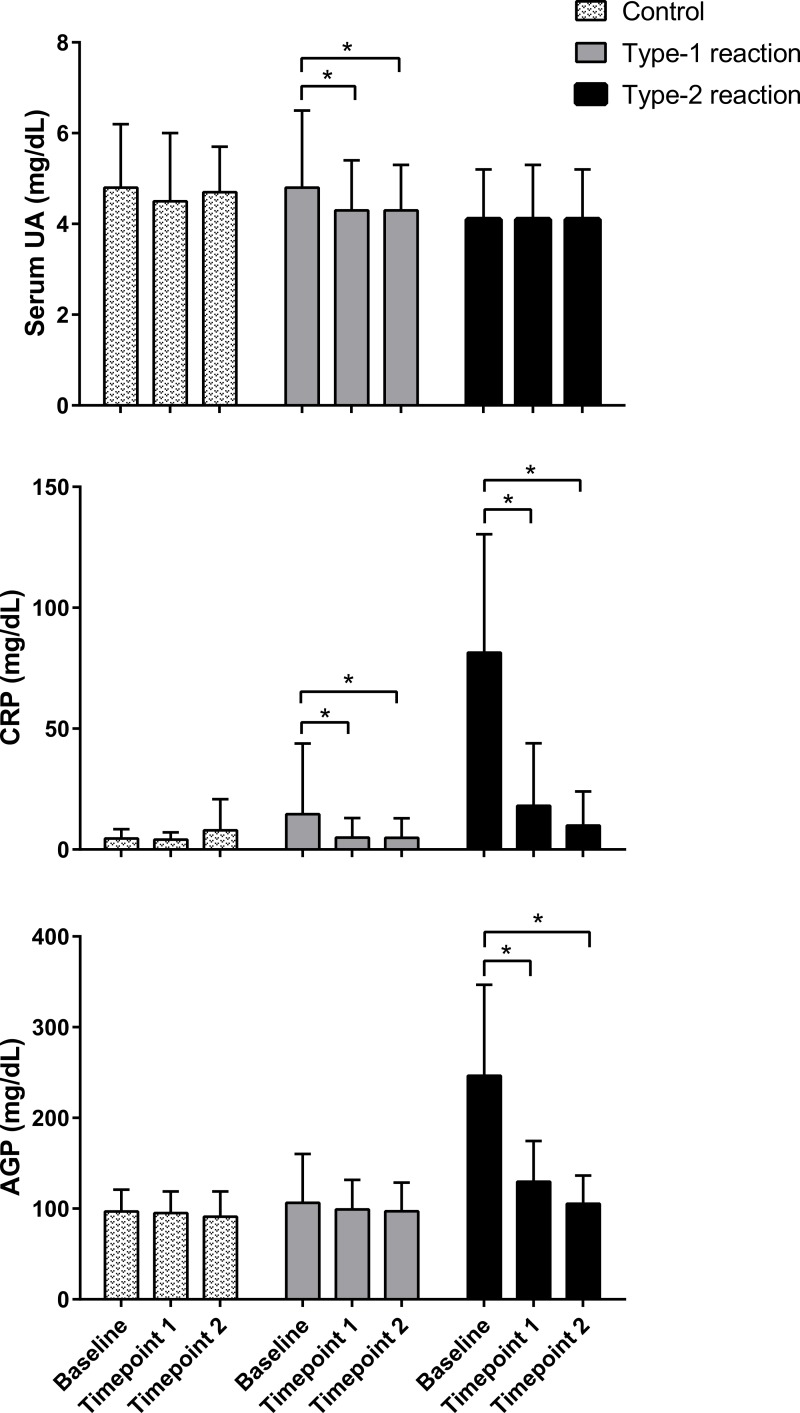
Figure 1. Follow-up evaluation of serum levels of uric acid, C-reactive protein, and α1-acid glycoprotein in patients with type 1 and type 2 leprosy reaction and in control patients.
The means ± standard deviation were calculated from patients upon admission (baseline) and at approximately 30 and 60 days (time points 1 and 2, respectively). n = 114, 117 and 115 at baseline; 103, 104, and 106 at time point 1; and 85, 83, and 87 at time point 2, respectively, for serum UA (uric acid), CRP (C reactive protein), and AGP (α1-acid glycoprotein). * p < 0.05.

