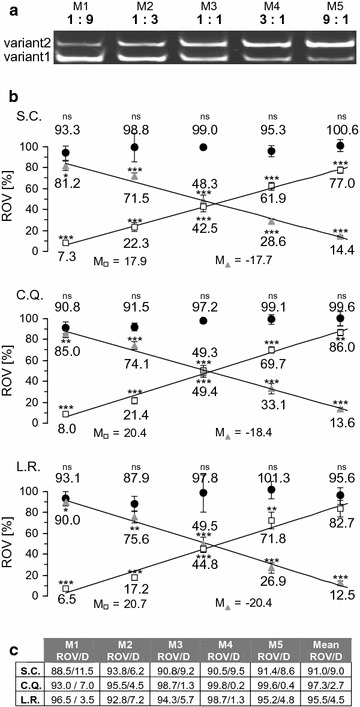
Fig. 6.

qPCR analysis of different ratios of cDNA variant 1 and 2. a Gel electrophoretic separation of amplification products obtained with control primer pair 2 and two plasmids encoding the cDNA of either variant2 or variant1 mixed in five different molar ratios M1– M5 as indicated. b Quantification of the different templates in the mixtures M1– M5 presented in A using four different primer pairs. PCR efficiencies (E) were determined using either standard curves (S.C.), the comparative quantitation tool of the Rotor gene software (C.Q.) or using non-baseline corrected data and the LinRegPCR software (L.R). Values for the relative incidences (RIV) of transcripts (x) were calculated using Cq values (Cqx) and E values (Ex) obtained with the control primer pair 1 (filled circles), primer pair +13, (open squares) and primer pair Δ13 (filled triangles) and the following equation: . Data of n = 6 independent experiments for M1–M3, n = 5 independent experiments for M4 and n = 8 independent experiments for M5 are shown with each reaction performed in triplicate. Statistical significance of differences to the starting amount of control2 amplicons (defined as 100 %) were tested using the unpaired two-tailed students t-test (*p < 0.05, **p < 0.01, ***p < 0.001, ns not significantly different p > 0.05). Linear regression analysis revealed correlation coefficients of at least 0.98 and slopes (M) as indicated. c Sum of the variant specific RIVs shown in b and their difference (D) to 100 %
