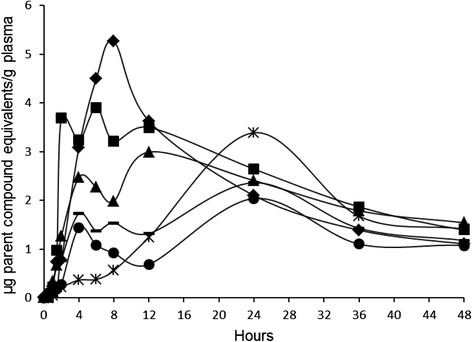
Fig. 2.

The individual time versus radioactivity concentration expressed as μg parent compound equivalents/g plasma of female Göttingen minipigs after a single oral dose of [9-14C]-oleic to animals that were pre-treated with formoline L112 between 0 and 48 h post-dose. The lines with the following markers ♦, ■, ▲,  , ▬ and ● represent animal B1, B2, B3, B4, B5 and B6 of the formoline L112 pre-treated group, respectively
