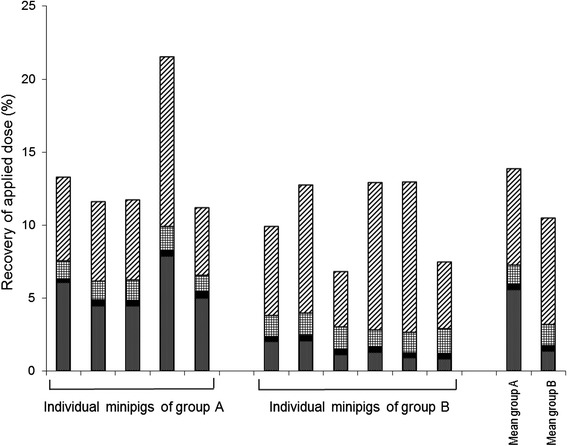
Fig. 5.

Individual and mean distribution and recovery of radioactivity in female Göttingen minipigs after a single oral dose of nominal 10 mg [9-14C-oleic acid/kg in group A (control) and group B (minipigs pre-treated with a single oral dose of 2 tablets of 500 mg formoline L112 per animal). Radioactivity is expressed as % parent compound. The following patterns  ,
,  ,
,  and
and  represent the amount of radioactivity in blood (Cmax), liver, urine and faeces/gastrointestinal tract, respectively
