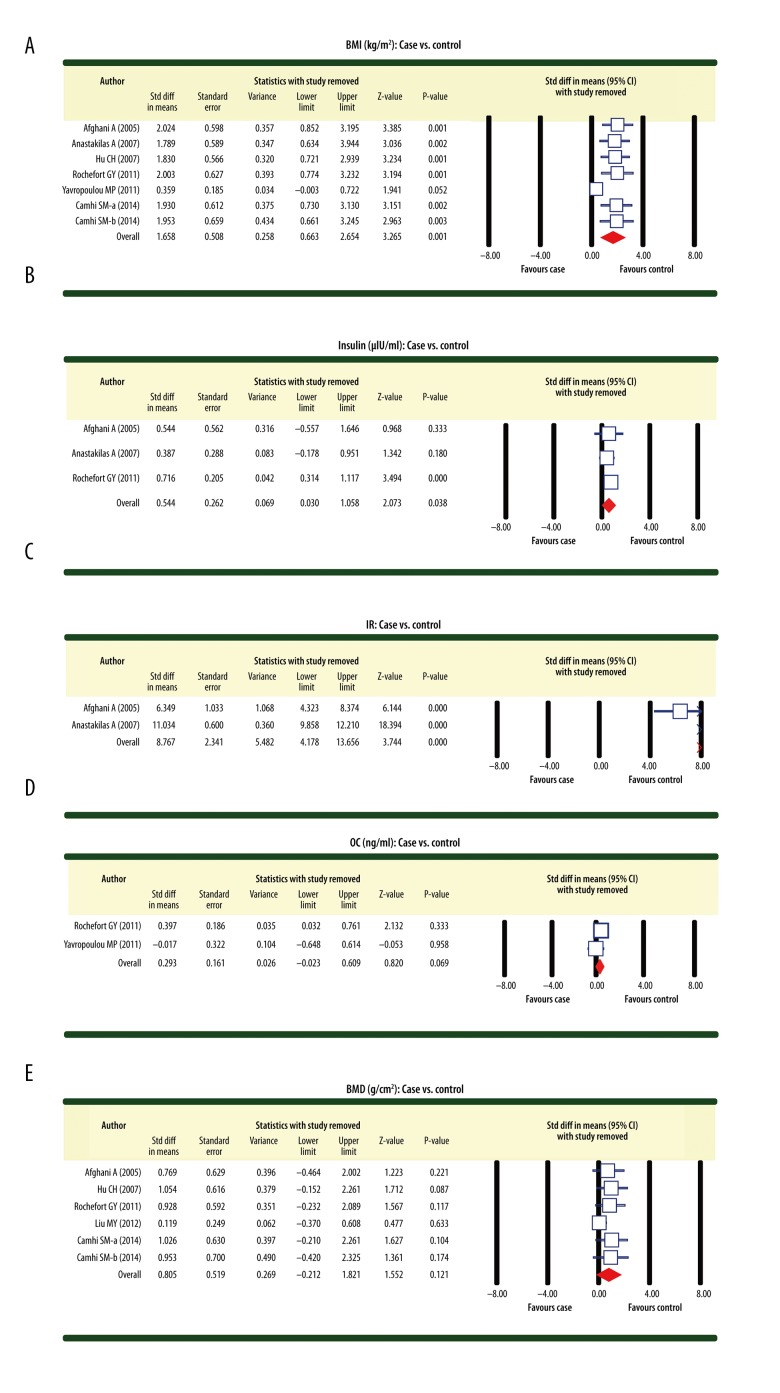
Figure 4.
Sensitivity analyses regarding the differences for osteocalcin, bone mineral density, body mass index, insulin, and insulin resistance between patients with abnormal glucose metabolism and healthy controls with normal glucose metabolism ((A) Body mass index (case vs. control); (B) Insulin (case vs. control); (C) Insulin resistance (case vs. control); (D) Osteocalcin (case vs. control); (E) Bone mineral density (case vs. control)).

