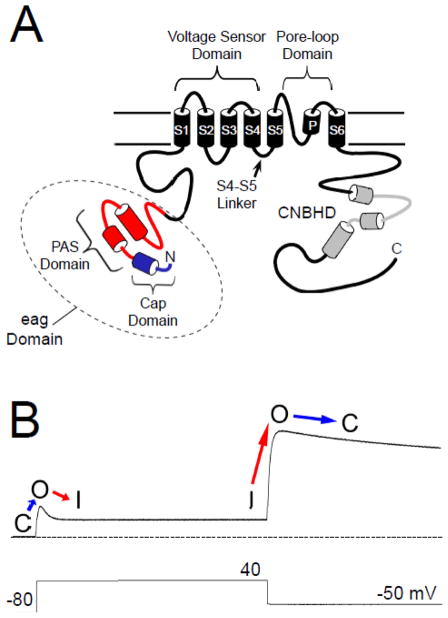
Fig. 1.
hERG channel topology and sample current. A. Schematic of the hERG K+ channel with key functional regions as indicated. The PAS domain is shown in red and the Cap domain is shown in blue. Together these comprise the eag domain. The cyclic nucleotide-binding homology domain is shown in grey. B. Sample hERG channel current in response to the pulse protocol indicated. With a depolarizing step, the channels transition from a closed (C) state to an open (O) state and then rapidly enter an inactive state (I). Upon repolarization, the channels rapidly recover from inactivation (I to O), and re-enter the open (O) state before slowly entering a closed (C) state. The dotted line represents zero current.

