
Fig. 3.
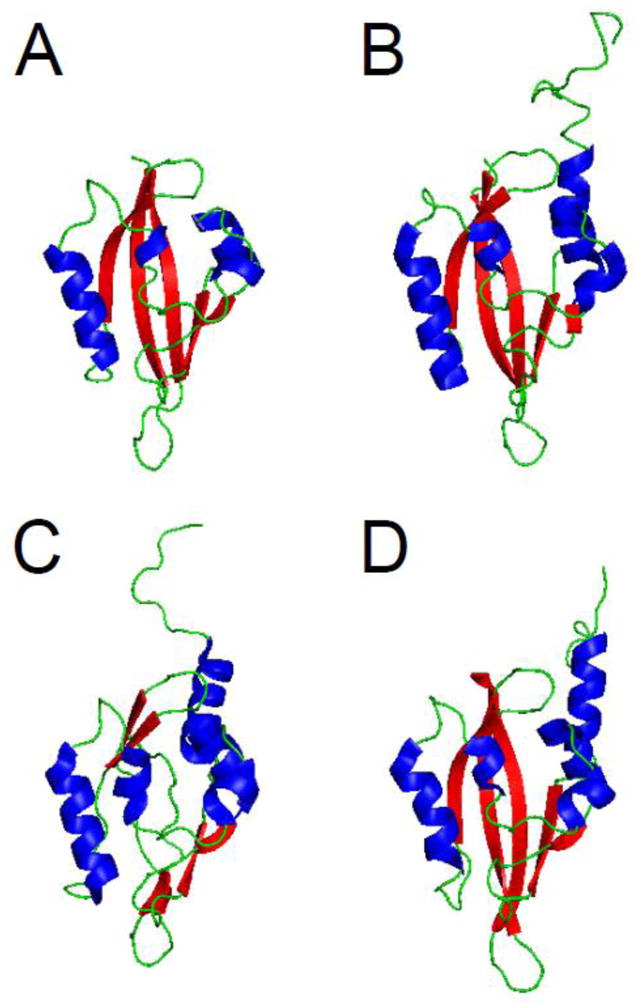
eag domain schematics. A. X- ray structure from Morais Cabral et al. 1998 (PDB ID: 1byw). Representative NMR structures, B. from Li et al. 2010 (PDB ID: 2l4r), C. from Muskett et al. 2010 (pdb: 2l1m), and D. from Ng et al. 2011 (pdb: 2l0w) [11, 50–52]. α-helix is shown in blue, β-sheet is shown in red, and loop regions are shown in green. Images were created using PyMOL (www.pymol.org).