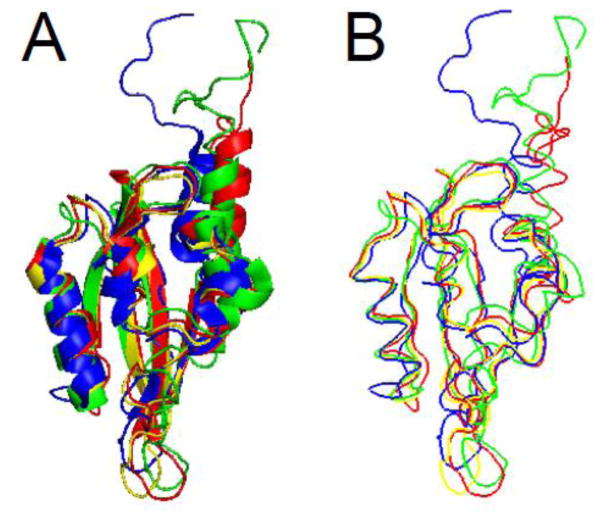
Fig. 4.
A. Ribbon diagram and B. protein backbone overlays of the eag domain structures. The X-ray structure (from Morais Cabral et al. 1998) is shown in yellow and representative NMR structures are shown in green (Li et al. 2010), blue (Muskett et al. 2010) and red (Ng et al. 2011) [11, 50–52]. The N-terminal disordered region and α-helix identified in the NMR structures were found to be dynamic. Image was created using PyMOL.

