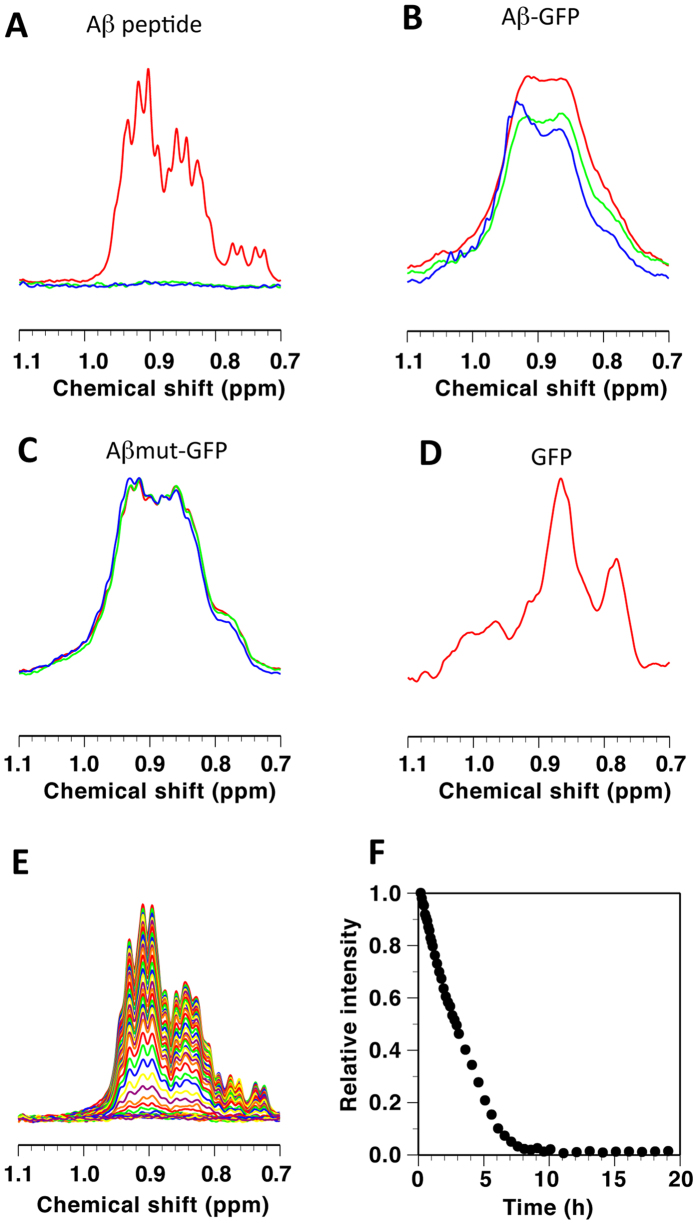
Figure 3. NMR analyses of structural changes in Aβ-GFP fusion proteins.
Shown are parts of 500-MHz NMR spectra mainly reflecting methyl groups for the Aβ peptide (A,E), Aβ-GFP (B), Aβmut-GFP (C), and GFP (D). Spectra in (A–D) were recorded at 20 °C, where the red, green and blue lines indicate intact peptides, those after incubation at 37 °C for 15.5 h, and those after incubation at 37 °C for 50 h or 63.5 h, respectively. Spectra in (E) were recorded at 37 °C after 5 min −19 h of incubation, where changes in the intensity of the highest peak at 0.91 ppm are shown in (F).

