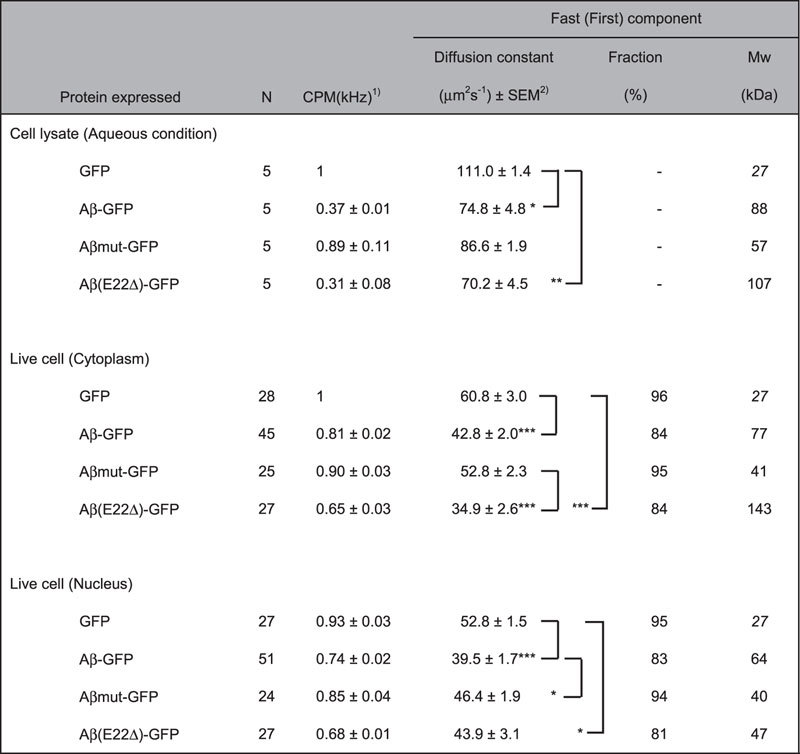
Table 1. FCS analysis of Aβ-GFP proteins in living cells.

1CPM values from lysate samples are normalized by that of GFP, and live-cell CPMs are normalized by that of GFP in cytoplasm.
2Kruskal-Wallis and post-hock tests are performed among each condition. Only the significant differences are shown: ***P < 0.001, **P < 0.01, *P < 0.05.
