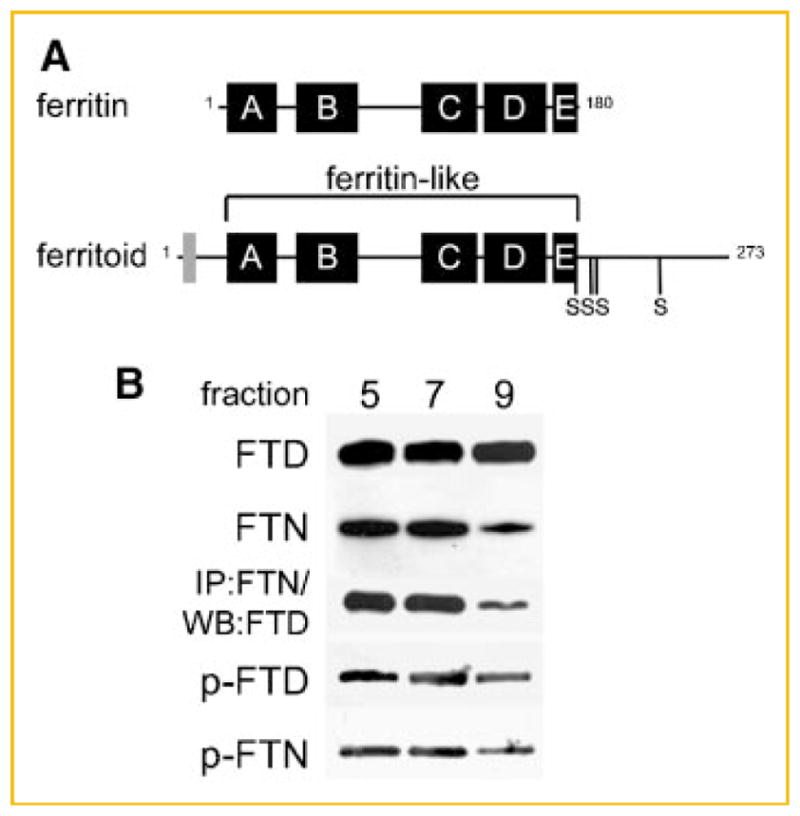
Fig. 1.

Analysis of phosphorylation in ferritoid–ferritin complexes. A: Schematic representation of ferritin and ferritoid sequences showing the 5 helical domains, A–E. In addition, the ferritoid sequence contains an SV40-type NLS (gray box) and a C-terminal tail containing four consensus phosphorylation sites at serines 186, 208, 212, and 240. B: Ferritinferritoid enriched protein lysate from E17 CE tissue, separated by gel-filtration chromatography on a Superdex-200 column, followed by SDS–PAGE and Western blot for ferritoid (FTD), ferritin (FTN), and phosphorylation of ferritoid and ferritin (p-FTD and p-FTN, respectively), or by immunoprecipitation with the anti-ferritin antibody followed by Western blot for ferritoid (IP:FTN/WB:FTD).
