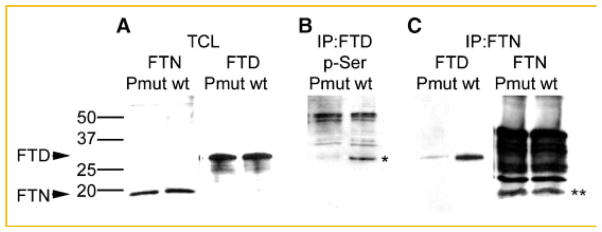
Fig. 3.
Analysis of the ferritoid–ferritin interaction in COS-1 cells following mutation of ferritoid phosphorylation sites. COS-1 cells co-transfected with ferritin and either the wild-type ferritoid (wt) or mutant ferritoid constructs (see Fig. 2B) analyzed for: (A) the presence of ferritin (FTN) and ferritoid (FTD) by Western blot; (B) the phosphorylation of ferritoid by immunoprecipitation with the anti-ferritoid antibody followed by Western blot for phospho-serine; or (C) ferritoid–ferritin binding by immunoprecipitation with the anti-ferritin antibody (IP:FTN) followed by Western blot for ferritoid (FTD) or ferritin (FTN). In (B) the ferritoid bands is demarcated by an asterisk. Higher molecular weight bands in (B) are due to reactivity of the phospho-serine antibody with the IgY antibody. In (C) the ferritin bands are demarcated by a double asterisk; higher molecular weight bands are due to reactivity of the secondary antibody with the IgG in the sample. A molecular weight marker is shown on the left of the figure with molecular weights for ferritoid (FTD) and ferritin (FTN) marked with labeled arrows.

