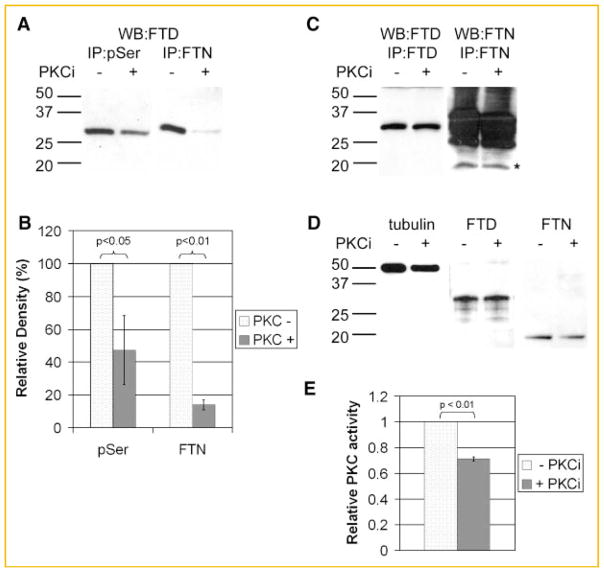
Fig. 4.
Analysis of the ferritoid–ferritin interaction in CE protein lysates from E8 whole corneas cultured in the presence (+) or absence (−) of PKC inhibitors. A: Western blot for ferritoid (WB:FTD) following immunoprecipitation of protein lysates with the anti-phospho-serine (IP:pSer) or the anti-ferritin (IP:FTN) antibodies. B: Quantitation of the bands from (A). Density of ferritoid bands in the presence of kinase inhibitors are expressed as a percentage of the density of ferritoid bands in the absence of inhibitors. All band densities are normalized to ferritoid bands in the corresponding total lysates. C: Western blot for ferritoid following immunoprecipitation with the anti-ferritoid antibody (WB:FTD/IP:FTD) or Western blot for ferritin following immunoprecipitation with the anti-ferritin antibody (WB:FTN/IP:FTN). The ferritin bands in B are marked by an asterisk. Higher molecular weight bands are due to reactivity of the secondary antibody with the IgG in the sample. D: Western blots of total lysates for tubulin, ferritoid (FTD), and ferritin (FTN). In (A,C,D), molecular weight markers are shown on the left. E: Kinase activity assay for PKC in the presence of PKC inhibitors normalized to PKC activity in the absence of inhibitors. Colorimetric reaction assayed at 492 nm and run in triplicate.

