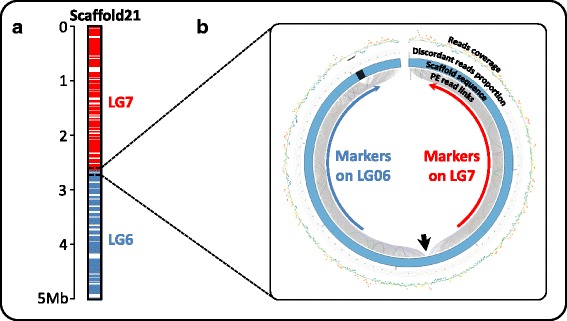
Fig. 2.

Example of a clue leading to scaffold splitting. a Genetic markers mapped onto scaffold21 belong respectively to linkage-group 7 (red) and linkage-group 6 (blue) suggesting a chimeric misassembly. b CIRCOS graphical representation of paired read mapping in the misassembled region. This representation is drawn using Scaffremodler’s tools. In the inner circle, links between read pairs are drawn with the following color code: grey lines correspond to concordant pairs (correct orientation and insert size), orange and red lines correspond to discordant pairs with smaller and greater insert size respectively. Purple lines correspond to pairs showing reverse-reverse orientation, green lines, forward-forward and blue lines correspond to pair with complete reverse orientation relative to the paired library construction. The second circle represents scaffold in blue with gaps as black regions. The next circles are scatter plots with warm-cool color code. The first scatter plot presents the proportion of discordant reads on window size of one third of expected read pair insert size. The outer circle represents a scatter plot of read coverage on window size of 100 bases. The black arrow points the misassembled region in scaffold21 leading to the assembly of two regions that are not linked
