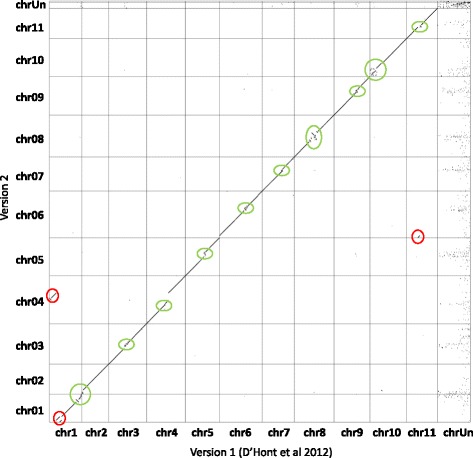
Fig. 5.

Dot plot comparison of gene order between the initial and the new version of Musa acuminata genome sequence assembly. A dot represents the position of a gene in the two assembly versions with the initial assembly on x axis and the new one on the y axis. Ruptures in the diagonal indicate differences of gene order. Red circles indicate the main differences and green circles indicate the variations resulting from the approximate scaffold order in the peri-centromeric regions. For instance, the version 2 of the assembly corrects a significant error between the chromosome 1 and 4
