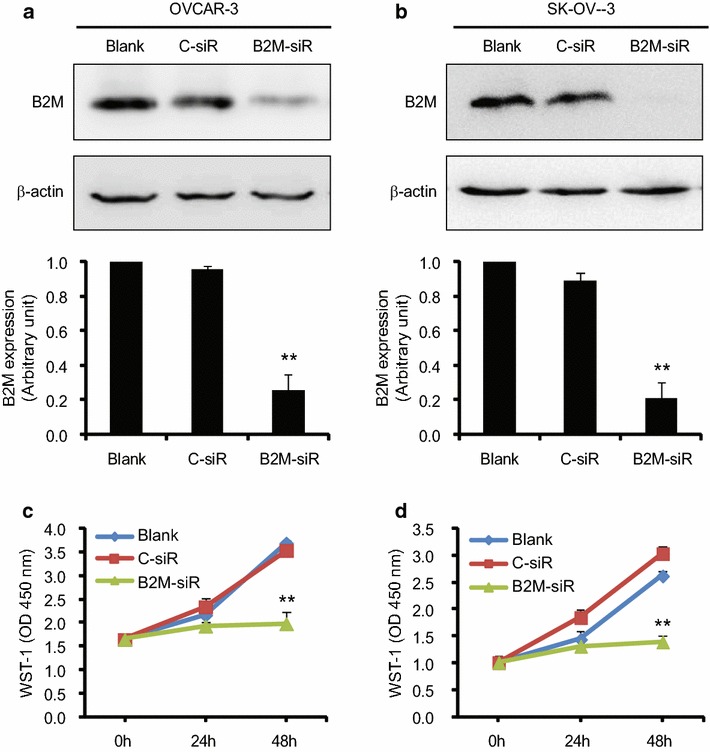
Fig. 2.

Measurement of cell proliferation. Transfection efficiency in OVCAR-3 (a) and SK-OV-3 (b) cells. A knocking down of B2M was detected by Western blot (top panel), followed by the densitometry of the gel (n = 3). The cell proliferation of OVCAR-3 (c) and SK-OV-3 (d) was determined by the WST-1 assay after siRNA transfection (n = 3). The results are representative of three independent experiments. Blank, control without transfection; C-siR, control siRNA; B2M-siR, B2M-siRNA. **P < 0.01
