Fig. 3.

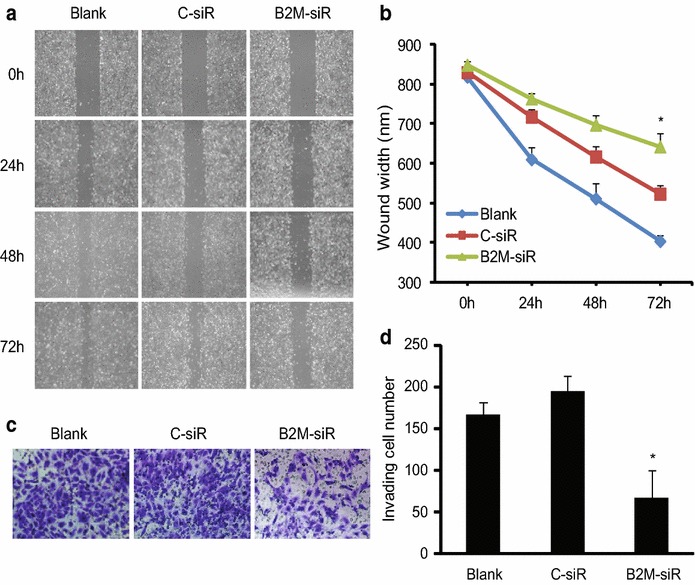
Migration and invasion of SK-OV-3 cells. a Migration of SK-OV-3 after transfection. A wound healing assay was performed and compared between the blank, negative control and B2M-siRNA transfected cells. The photos of wounds were taken at different times. Original magnification × 100. b The quantitative analysis of the wound width was shown in the line chart. Three independent experiments were conducted and similar results were obtained. c Invasion of SK-OV-3 after transfection. The invasive property of the cells was determined at 48 h by invasion assays using Matrigel invasion chambers and the photos were taken. Original magnification × 200. d Quantification of invading cells. The results are plotted as the average number of invading cells from three random microscopic fields. Three independent experiments were performed and similar results were obtained. *P < 0.05
