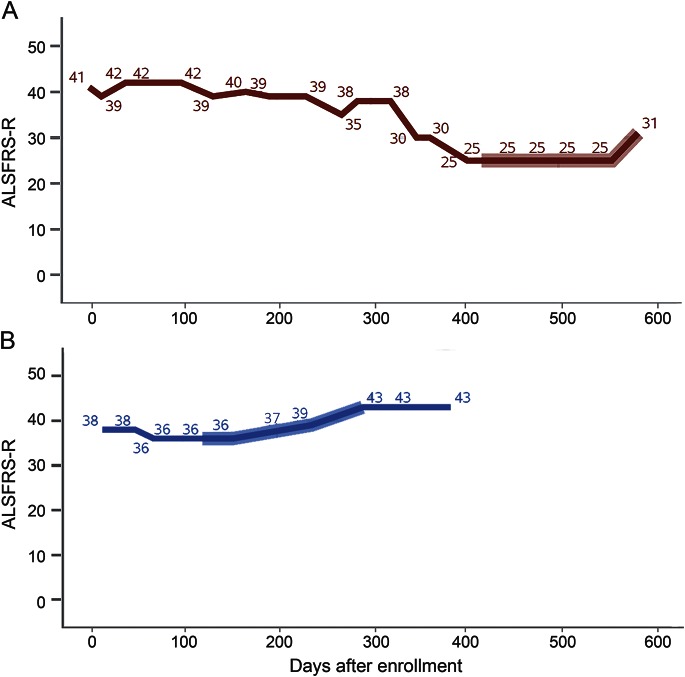
Figure 2. Closer look at amyotrophic lateral sclerosis reversals.
These graphs show 2 individual Pooled Resource Open-Access ALS Clinical Trials participants' Amyotrophic Lateral Sclerosis Functional Rating Score–revised (ALSFRS-R) scores over time. The portion of the curve picked up as an amyotrophic lateral sclerosis reversal is highlighted. Some of these reversals appear to be the result of a single data point (participant A, last data point). Others include multiple incrementally improving data points, which are potentially more interesting (participant B).

