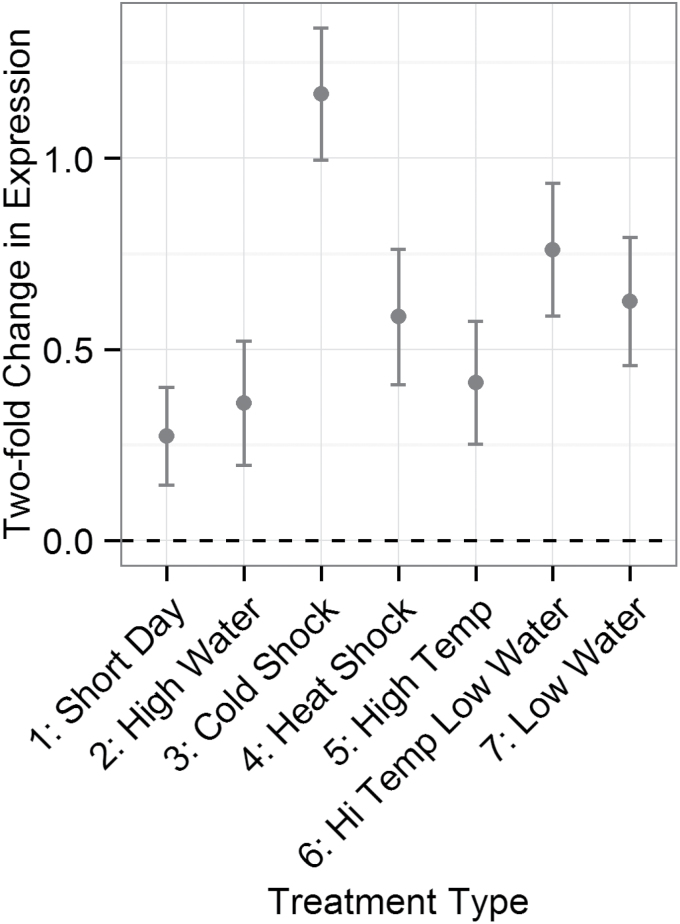
Fig. 1.
Coefficients of a linear model of R-gene expression against treatment for 13 R-genes in 12 accessions in Arabidopsis thaliana. R-genes and all interactions with R-genes were included as random effects in the model. The y-axis corresponds to a log2 fold change in expression for each treatment relative to the control treatment.

