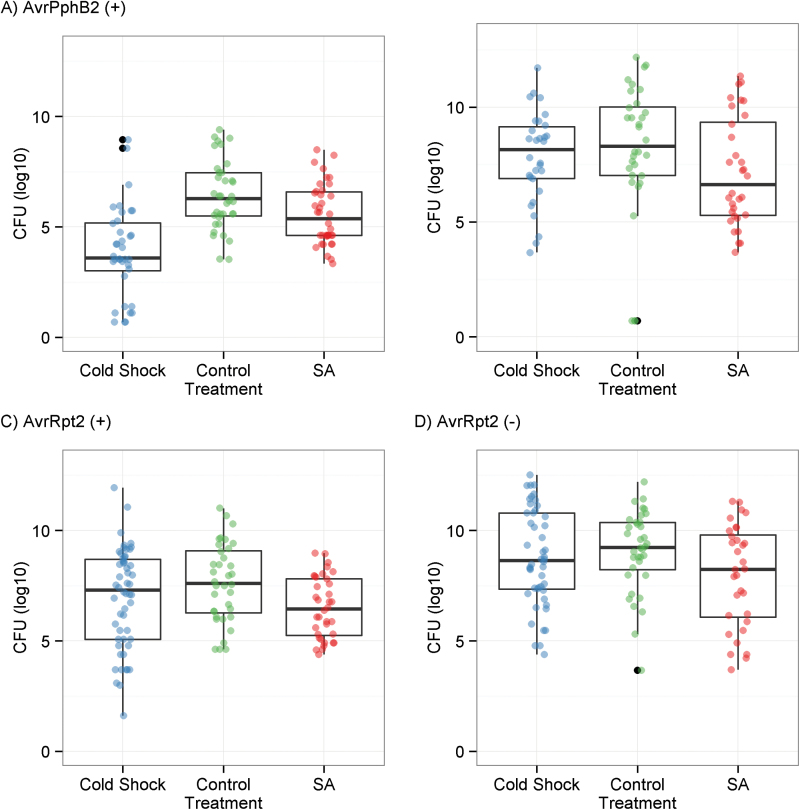
Fig. 2.
Bacterial titers measured 3 d post-infection for Arabidopsis thaliana plants exposed to three treatments then infected by two pairs of Pseudomonas syringae strains. Data are overlaid as jittered points. (A) Infection with P. syringae pv. AvrPphB2; (B) infection with P. syringae (–) AvrPphB2; (C) infection with P. syringae pv. AvrRpt2; (D) infection with P. syringae (–) AvrRpt2. (This figure is available in colour at JXB online.)

