Fig. 3.
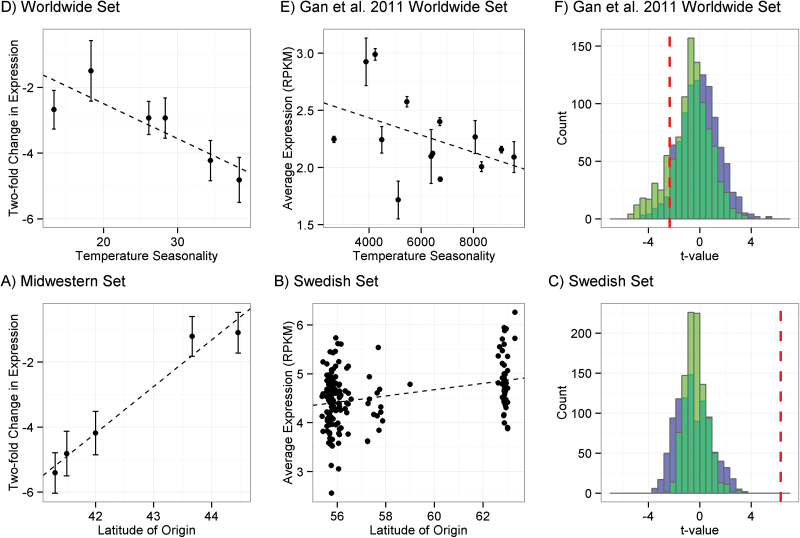
Clinal variation in basal R-gene expression in Arabidopsis thaliana. Dashed lines are regression lines. (A, D) The y-axes corresponds to the log2 basal expression for each accession in short-day conditions. (A) Expression variation of 13 R-genes in accessions from the Clark worldwide set against temperature seasonality at the accession’s location of origin. (B) Average expression of 150 R-genes in accessions from the Gan worldwide set against temperature seasonality at the accession’s location of origin. (C) The null distributions of t-values of correlations with temperature seasonality for 1000 sets of 150 randomly sampled gene expression profiles from the Gan worldwide set. Null distributions were drawn from all genes (blue) and stress response annotated genes (green). The dashed vertical line is the t-value of the correlation from (B). (D) Expression variation of 13 R-genes in accessions from the Midwestern set against latitude of origin. (E) Average expression of 150 R-genes in accessions from the Swedish set against latitude of origin. (F) The null distributions of t-values of correlations with temperature seasonality for 1000 sets of 150 randomly sampled gene expression profiles for the Swedish set. Null distributions were drawn from all genes (blue) and stress response annotated genes (green). The dashed vertical line is the t-value of the correlation from (E).

