
Figure 4.
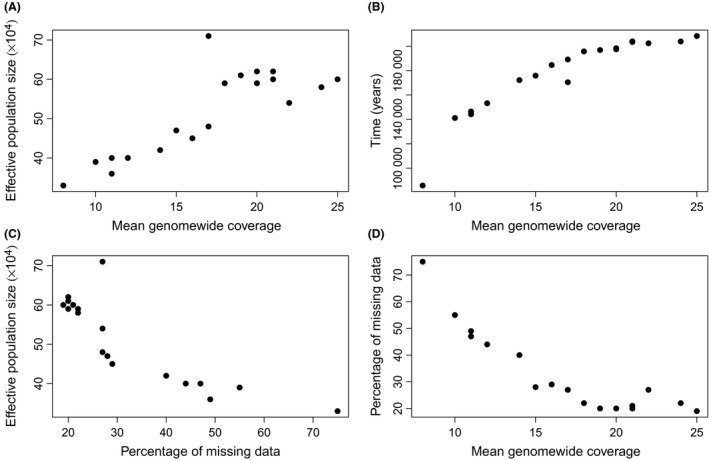
Correlations between maximum N e estimate and mean genomewide coverage (A), timing of the maximum N e estimate and mean coverage (B), maximum N e estimate and percentage of missing data (C), and percentage of missing data and mean coverage (D).