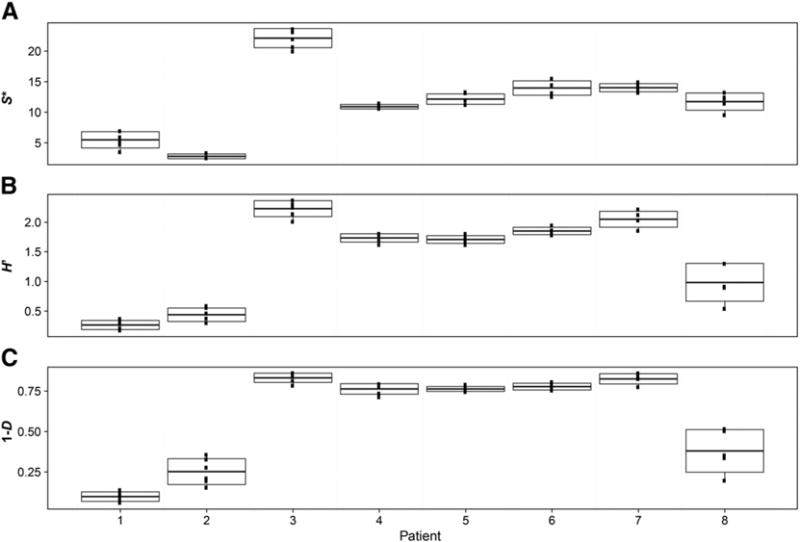
Fig. 1.

Boxplots from each patient showing variation in diversity over the 6 freeze–thaw cycles. Values of (A) species richness (S*), (B) Shannon–Wiener index of diversity (H′), and (C) Simpson’s index of diversity (1-D) were calculated with a uniform re-sample size following 1000 iterations in each instance. Lines in boxplot represent mean and standard deviation of the mean (n = 6); whiskers represent 25th and 75th percentiles.
