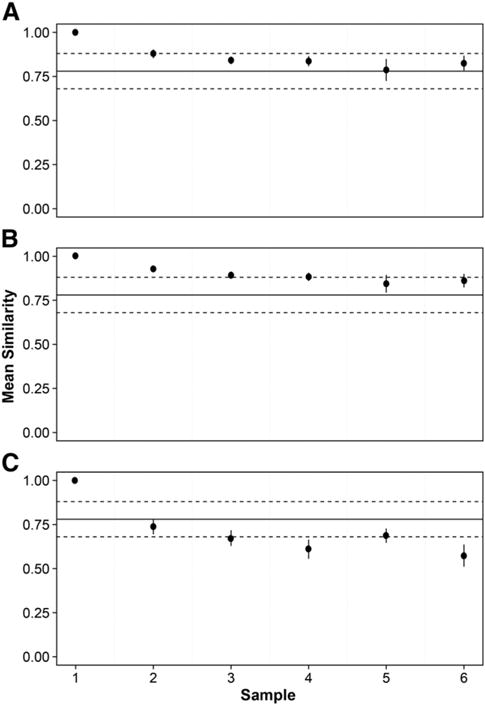
Fig. 2.

Mean changes in bacterial community composition over six freeze–thaw cycles, using Bray–Curtis index of similarity for (A) whole communities, (B) common and (C) rare species groups. Error bars represent the standard error of the mean (n = 6). Whole community similarity was calculated with a uniform re-sample size following 1000 iterations. Solid lines represent the overall mean similarity for within sample replicates and dashed lines represent the standard error of the mean (n = 24).
