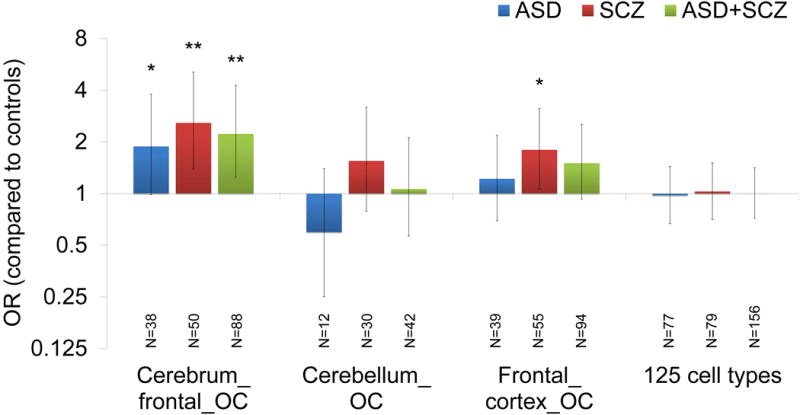
Figure 3. Enrichment Analyses of Synonymous Mutations within DNase I hypersensitive sites.

Enrichment analyses of de novo synonymous mutations within DNase I hypersensitive sites (DHS) using the data derived from brain tissues (Cerebrum_frontal_OC, Cerebellum_OC and Frontal_cortex_OC) and the integrated data of 125 cell types. The numbers below the bars indicate the number of each type of synonymous mutations. Error bars indicate 95% CI. P values were calculated by 1-tailed 2×2 Fisher’s exact tests. *p < 0.05, ** p < 0.005, *** p < 0.0005. ASD; autism spectrum disorders, OR; odds ratio, SCZ; schizophrenia, SS; splice site.
