
Figure 2. Distributions of Norovirus Variants in Representative Immunocompetent and Immunocompromised Hosts.
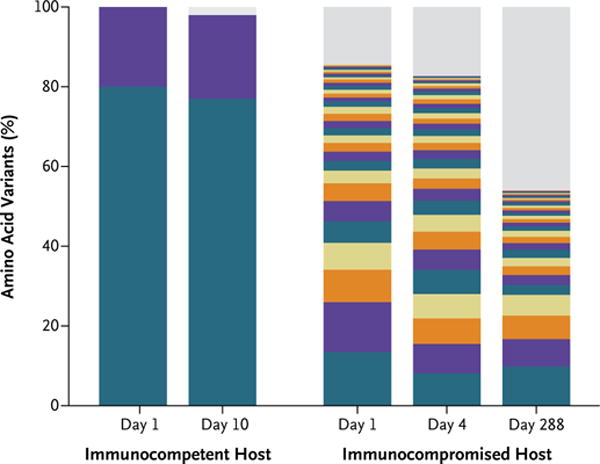
The bar graph shows the frequency distribution of VP1 norovirus variants, identified through next-generation sequencing, in an immunocompetent host and an immunocompromised host. Each unique variant is represented by a different color. Given the limited color palette, repeated colors represent distinct variants. Low-frequency variants, with an estimated frequency of occurrence below the detection threshold (2%), are shown in gray. Only two variants were detected in the immunocompetent host, and they remained stable throughout the 10 days of infection. No predominant variant was observed in the immunocompromised host. Instead, numerous low-frequency variants coexisted, and their prevalences varied over the course of the infection. Adapted from Bull et al.34