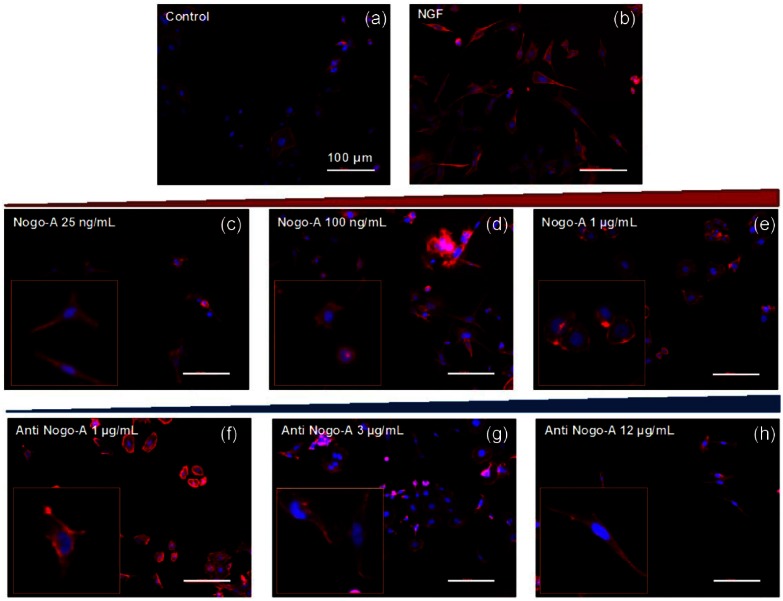
Figure 2.
Immunofluorescent images of PC-12 cells stained for actin and tubulin using Alexa Fluor-555 Phalloidin and for cell nuclei using DAPI. (a) untreated, (b) NGF treated, (c) pretreated with NGF and post-treated with Nogo-A 25 ng/mL, (d) pretreated with NGF and post-treated with Nogo-A 100 ng/mL, (e) pretreated with NGF and post-treated with Nogo-A 1 µg/mL, (f) pretreated with NGF and Nogo-A 1 µg/mL and post-treated with anti-Nogo-A 1 µg/mL, (g) pretreated with NGF and Nogo-A 1 µg/mL and post-treated with anti-Nogo-A 3 µg/mL, and (h) pretreated with NGF and Nogo-A 1 µg/mL and post-treated with anti-Nogo-A 12 µg/mL. All scale bars represent 100 µm.

