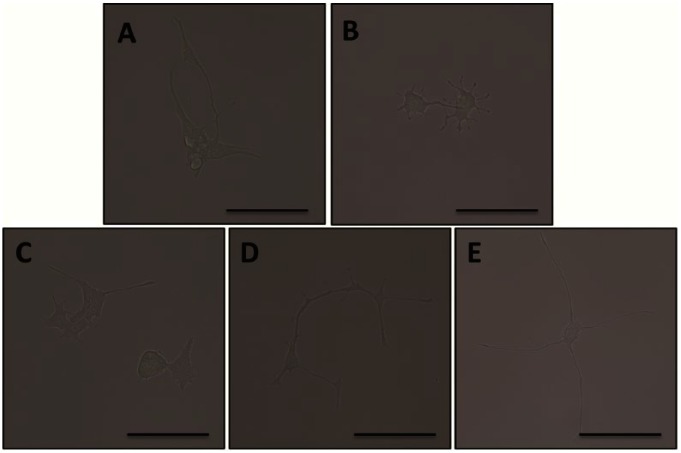
Supplementary Figure S1.
Bright field images of PC-12 cells at day 5 treated with (A) NGF; (B) pretreated with NGF and post-treated with Nogo-A; (C) pretreated with NGF and Nogo-A and post-treated with anti-Nogo-A 1 μg/mL; (D) pretreated with NGF and Nogo-A and post-treated with anti-Nogo-A 3 μg/mL; (E) pretreated with NGF and Nogo-A and post-treated with anti-Nogo-A 12 μg/mL. All scale bars represent 100 μm.

