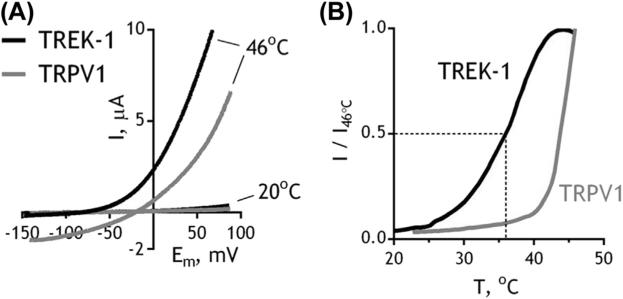
Figure 5.2.
A comparison of temperature activation profiles between TREK-1 and TRPV1. (A) Current–voltage plots showing the activity of TREK-1 and TRPV1 recorded by two-electrode voltage clamp in Xenopus oocytes at different temperatures. Currents were evoked in a “physiological” solution (2 mM KCl, 96 mM NaCl, 1.8 mM CaCl2, 2 mM MgCl2, 5 mM HEPES pH 7.4) by a 1-s-long voltage ramp from a holding potential of −80 mV. (B) Normalized activity of TREK-1 and TRPV1 at different temperatures, measured at 40 mV.

