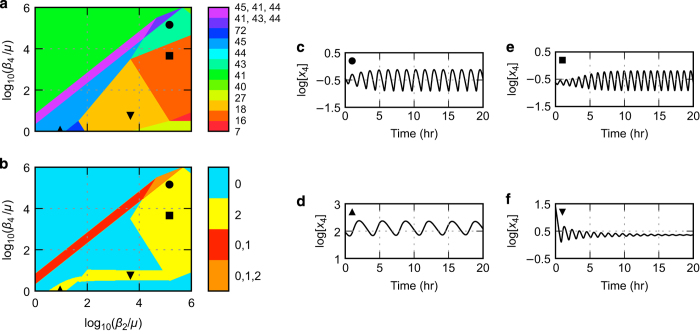
Figure 3.
Example of an ensemble of four oscillatory phenotypes in a two-dimensional slice of system design space for the D.12 design. (a,b) System design space with the effective rate constant for inactivation of the two regulators on the x and y axes, normalized with respect to the growth rate, μ, with a 1 h doubling time. See caption of Figure 2 for details. (c–f) Temporal behavior of normalized repressor concentration x4 determined by simulation of the full system within the phenotypic regions of potentially oscillation in panels (a,b) indicated by the symbols in the upper-left corners (regions 43 ●, 16 ■, 45 ▲ and 18 ▼). It should be noted that sustained oscillations may dynamically cycle through different qualitatively distinct phenotypes in state space.11

