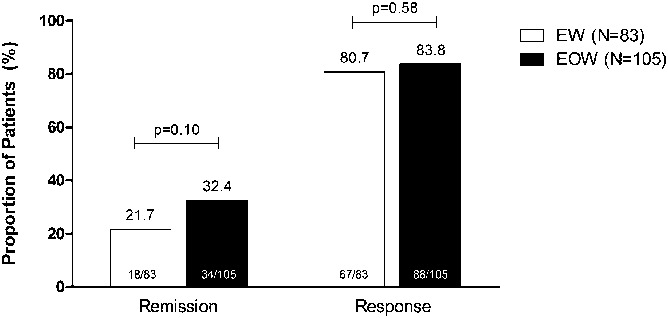
FIGURE 3.

Proportion of patients with remission and response at week 4 in patients who remained on every other week dosing (black bars, N = 105) and who escalated to blinded weekly dosing after week 12 (white bars, N = 83). Nonresponder imputation analysis. EOW, every other week; EW, weekly.
