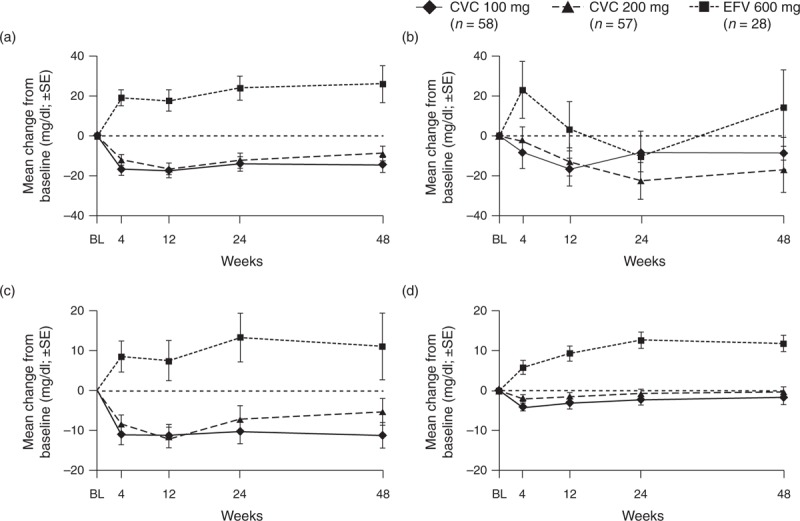
Fig. 1.
Mean changes from baselinea in fasting metabolic parameters in each treatment group over the 48-week duration of the study.

(a) Total cholesterol (b) triglycerides (c) LDL cholesterol (d) HDL cholesterol (safety population). BL, baseline; CVC, cenicriviroc; EFV, efavirenz; HDL, high-density lipoprotein; LDL, low-density lipoprotein; SE, standard error. aBaseline defined as the last nonmissing assessment prior to initiation of study treatment.
