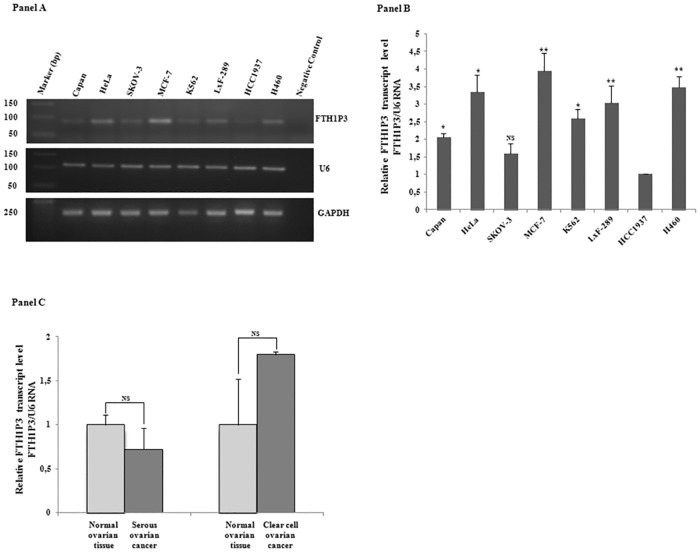
Fig 2.
Panel A. RT-PCR analysis of FTH1P3 transcript in the cancer cell lines Capan, HeLa, SKOV-3, MCF-7, K562, LxF-289, HCC1937, H460. U6 and GAPDH transcripts were used as reference genes. Panel B. qPCR analysis of FTH1P3 in the cancer cell lines; U6 RNA is the reference gene. Data are the mean ± SD of three independent experiments (*p<0.05; **p<0.001). Panel C. qPCR analysis of FTH1P3 in serous and clear cell ovarian cancer and in normal tissue counterparts. Data are the mean ± SD of three independent experiments. NS: p value not significant.

